The horrors and wonders of crowdfunding
Have you ever wondered what kinds of personal projects people put on crowdfunding sites? Do they most frequently ask you to fund their tech startups or wish to realize their musical talent? We got you covered! If you are curious about the nitty-gritty of online crowdfunding, specifically Indiegogo, a popular site with over 9 millions users, this article is for you!
Indiegogo welcomes all kinds of project fundraising. This diversity is unique to them, whereas competitors like Kickstarter and GoFundMe focus on creative projects or personal campaigns.
Our analysis is enabled by Web Robots’ monthly crawl (data scraping) on Indiegogo projects. Their datasets provide a useful overview of a project’s type, fundraising goal, final-raised amount, and so on. We will first walk you through how we converted Web Robots’ dataset to a tidy, R-friendly format, and then present our analysis.
Data wrangling
Since Web Robots(WB) scrape monthly, we downloaded two sets from Jan 2021 and Jan 2019 to account for variations. We have thus made the following changes to their datasets: * Conducted a random sampling of 1500 projects from each dataset. This is useful because each WB’s dataset contains * 30k+ projects, creating an issue of overplotting. * Gave date-related columns a consistent format(yyyy/mm/dd) * Selected only important columns * Dropped missing values
We finally merged them together. (Click Show code to check out any code you are interested)
Show code
#Get raw data from Web Robots
crowfund_21 <- read_csv(here("_posts/2021-03-25-popular-and-profitable-projects-on-indiegogo/data/2021_01_Indiegogo.csv"))
crowfund_19 <- read_csv(here('_posts/2021-03-25-popular-and-profitable-projects-on-indiegogo/data/2019_01_Indiegogo.csv'))

#randomly select 1500 projects from each dataset
subset_21 <- crowfund_21 %>%
  sample_n(1500)
subset_19 <- crowfund_19 %>%
  sample_n(1500)
#separate date-related cols to improve date formatting and give a 'Date' class
#and some other cleaning
subset_21 <- subset_21 %>%
  separate(open_date,c("open_date", "B"), sep = "(T)") %>%
  separate(close_date, c("close_date", "D"), sep = "(T)") %>%
  mutate(open_date = as.Date(open_date),
         close_date = as.Date(close_date)) %>%
  select(c(category, open_date, close_date, currency,
           funds_raised_amount, funds_raised_percent,
           project_type, source_url, tagline,
           tags, title)) %>%
  drop_na(c(close_date, open_date))

#repeat for another subset
subset_19 <- subset_19 %>%
  separate(open_date, c("open_date", "B"), sep = "(T)") %>%
  separate(close_date, c("close_date", "D"), sep = "(T)") %>%
  mutate(open_date = as.Date(open_date),
         close_date = as.Date(close_date)) %>%
  select(c(category, open_date, close_date, currency,
           funds_raised_amount, funds_raised_percent,
           project_type, source_url, tagline,
           tags, title)) %>%
  drop_na(c(close_date, open_date))

#join two data frames and write a csv file containing all randomly selected projects
subset<- rbind(subset_19, subset_21)
write_csv(subset, "indiegogo_sub.csv")
And now, we are ready for some fun analysis.
What kinds of projects make the most money?
Our first goal was to find the 15 projects that raised the most money. We were curious to know the fundraising goal of these projects (the dataset didn’t tell us) so we made a new column by dividing the amount of funds raised by the percent of funds raised. We also decided to only include projects in USD for easy comparison.
Show code
##TABLE 1 "Top 15" wrangling
indiegogo_tags <- indiegogo %>%
  separate(tags, c("tag0", "tag1", "tag2", "tag3", "tag4", "tag5")) %>%
  select(-tag0)

table_data <- indiegogo_tags %>%
  mutate(fundraising_goal = funds_raised_amount/funds_raised_percent) %>%
  filter(currency == "USD") %>%
  select(open_date, title, category, tag1, fundraising_goal, funds_raised_amount, funds_raised_percent) %>%
  slice_max(order_by = funds_raised_amount, n = 15) %>%
   mutate(funds_raised_amount = as.character(funds_raised_amount))
Show code
#TABLE 1
table_data %>%
gt() %>%
  cols_label(
open_date = "Date Opened",
title = "Title",
category = "Category",
tag1 = "Tag",
fundraising_goal = "Goal (USD)",
funds_raised_amount = "Amount Raised (USD)",
funds_raised_percent = "Times Goal Raised"
) %>%
tab_header(title = md("Top Fundraisers"),
subtitle = "The 15 highest earning indiegogo projects") %>%
tab_footnote(footnote = "Number of times the goal amount was raised, a 1 indicates that goal equals funds raised.",
locations = cells_column_labels(
columns = vars(funds_raised_percent)
)) %>%
tab_footnote(footnote = "Only projects using USD were considered to allow ease of comparison",
locations = cells_column_labels(
columns = vars(fundraising_goal)
)) %>%
tab_source_note(source_note = "Source: https://webrobots.io/projects/") %>%
  data_color(
columns = vars("funds_raised_percent"),
colors = scales::col_numeric(
as.character(paletteer::paletteer_d("ggsci::amber_material",
n = 10)),
domain = c(2, 530)
)) %>%
fmt_number(
    columns = 5,
    decimals = 0,
    suffixing = TRUE) %>%
fmt_number(
    columns = 7,
    decimals = 2,
    suffixing = FALSE)
| Top Fundraisers | ||||||
|---|---|---|---|---|---|---|
| The 15 highest earning indiegogo projects | ||||||
| Date Opened | Title | Category | Tag | Goal (USD)1 | Amount Raised (USD) | Times Goal Raised2 |
| 2015-12-11 | G-RO: Revolutionary Carry-on Luggage | Travel & Outdoors | bags | 173K | 4573569 | 26.46 |
| 2015-06-16 | Micro Drone 3.0: Flight in the Palm of Your Hand | Travel & Outdoors | drones | 118K | 3615443 | 30.76 |
| 2019-04-25 | THE ONE - World's Lightest Electric Folding Bike! | Transportation | e | 158K | 3431322 | 21.75 |
| 2016-08-30 | The NOMATIC Travel Bag | Travel & Outdoors | backpacks | 38K | 3281915 | 86.27 |
| 2016-04-20 | SpeedX Leopard - first ever smart aero road bike | Transportation | bikes | 68K | 3164893 | 46.40 |
| 2013-10-28 | Geek Pulse DAC: High-Rez Desktop DAC System | Audio | other | 97K | 3001353 | 30.90 |
| 2018-10-17 | Vinpok Split - Best On-the-go Touch Screen Monitor | Productivity | computers | 5K | 2841457 | 529.08 |
| 2017-01-13 | The Everlast Notebook | Productivity | other | 39K | 2766722 | 70.12 |
| 2016-07-27 | ZUNGLE : Wear the Beats | Audio | sunglasses | 70K | 2732946 | 38.94 |
| 2017-02-27 | Gemini PDA Android & Linux keyboard mobile device | Phones & Accessories | other | 890K | 2531792 | 2.84 |
| 2018-07-03 | Scribit - Turn your wall into a wonderwall | Home | robots | 72K | 2373444 | 32.83 |
| 2016-09-26 | SMOVE: Smartphone Stabilizers & PowerBank in One | Phones & Accessories | smart | 48K | 2212680 | 46.46 |
| 2019-09-24 | Juiced SCORPION - Moped Style E-Bike | Transportation | e | 50K | 2205808 | 43.89 |
| 2018-02-27 | Använda. A Great F*cking Bag. | Fashion & Wearables | bags | 19K | 1758132 | 93.60 |
| 2014-05-13 | Geek Wave: A No-compromise Portable Music Player | Music | other | 48K | 1665254 | 34.79 |
| Source: https://webrobots.io/projects/ | ||||||
|
1
Only projects using USD were considered to allow ease of comparison
2
Number of times the goal amount was raised, a 1 indicates that goal equals funds raised.
|
||||||
We did similar wrangling to generate the Middle 15 Table. First we determined the median funds raised, then we selected the 15 projects closest to the median of funds raised.
Show code
#TABLE 2 Selecting Middle 15 (15 rows between 1202 - 1257, median = 1215)
table_data2 <- indiegogo_tags %>%
  mutate(fundraising_goal = funds_raised_amount/funds_raised_percent) %>%
  filter(currency == "USD") %>%
  arrange(desc(funds_raised_amount)) %>%
  mutate(funded = case_when(funds_raised_percent >= 1 ~"Yes",
                            funds_raised_percent < 1 ~ "No")) %>%
  filter(funds_raised_amount %in% (1202:1257)) %>%
  select(open_date, title, category, funded, tag1, fundraising_goal, funds_raised_amount, funds_raised_percent) %>%
   mutate(funds_raised_amount = as.character(funds_raised_amount))
Show code
#TABLE 2
table_data2 %>%
gt() %>%
  cols_label(
open_date = "Date Opened",
title = "Title",
category = "Category",
funded = "Project funded?",
tag1 = "Tag",
fundraising_goal = "Goal (USD)",
funds_raised_amount = "Amount Raised (USD)",
funds_raised_percent = "Proportion of Goal Raised"
) %>%
tab_header(title = md("Middle Fundraisers"),
subtitle = "Fifteen indiegogo projects nearest the median of funds raised") %>%
tab_footnote(footnote = "Project was either fully funded (Yes) or not fully funded (No)",
locations = cells_column_labels(
columns = vars(funded)
)) %>%
tab_footnote(footnote = "Only projects using USD were considered to allow ease of comparison",
locations = cells_column_labels(
columns = vars(fundraising_goal)
)) %>%
tab_footnote(footnote = "How much of the goal amount was actually raised, 1 indicates amount raised equals goal.",
locations = cells_column_labels(
columns = vars(funds_raised_percent)
)) %>%
tab_source_note(source_note = "Source: https://webrobots.io/projects/") %>%
data_color(
columns = vars("funds_raised_percent"),
colors = scales::col_numeric(
as.character(paletteer::paletteer_d("ggsci::amber_material",
n = 10)),
domain = c(0.02, 1.8)
)) %>%
fmt_number(
    columns = 6,
    decimals = 0,
    suffixing = TRUE) %>%
fmt_number(
    columns = 8,
    decimals = 2,
    suffixing = FALSE)
| Middle Fundraisers | |||||||
|---|---|---|---|---|---|---|---|
| Fifteen indiegogo projects nearest the median of funds raised | |||||||
| Date Opened | Title | Category | Project funded?1 | Tag | Goal (USD)2 | Amount Raised (USD) | Proportion of Goal Raised3 |
| 2019-06-29 | Monarch Laser | Art | No | design | 15K | 1257 | 0.08 |
| 2015-08-25 | Magni Cable | Phones & Accessories | No | other | 12K | 1255 | 0.10 |
| 2018-06-15 | Infinity X- Completely Waterproof 800 Watt Speaker | Audio | Yes | speakers | 710 | 1247 | 1.76 |
| 2020-05-11 | Tin Foil Top Hat: 2nd Album | Music | No | album | 5K | 1234 | 0.25 |
| 2018-12-16 | New Django Soulo Album: Alone Together | Music | No | album | 6K | 1231 | 0.21 |
| 2020-02-01 | Null And Void Season One | Podcasts, Blogs & Vlogs | No | indie | 3K | 1225 | 0.37 |
| 2013-10-10 | The Human Virus - A Feature Film | Film | No | other | 5K | 1217 | 0.24 |
| 2018-10-27 | B-Sides the Series | Web Series & TV Shows | No | women | 20K | 1216 | 0.06 |
| 2018-02-09 | Booster Mom Season One | Web Series & TV Shows | No | female | 15K | 1214 | 0.08 |
| 2019-04-19 | WaterHouseCollective Presents - A Minute Flowering | Dance & Theater | No | indie | 1K | 1213 | 0.81 |
| 2015-07-15 | All-Natural Acai Soda by Acai Brand Co. | Local Businesses | No | other | 47K | 1207 | 0.03 |
| 2012-10-18 | Ten Thousand South | Health & Fitness | Yes | other | 1K | 1205 | 1.21 |
| 2014-09-16 | Alex Barelos Professional Photography Start-Up | Photography | No | other | 5K | 1205 | 0.24 |
| 2014-08-03 | campaign ended | Productivity | No | other | 20K | 1204 | 0.06 |
| 2015-05-20 | NorwegianWoodPickers | Fashion & Wearables | No | other | 5K | 1202 | 0.24 |
| Source: https://webrobots.io/projects/ | |||||||
|
1
Project was either fully funded (Yes) or not fully funded (No)
2
Only projects using USD were considered to allow ease of comparison
3
How much of the goal amount was actually raised, 1 indicates amount raised equals goal.
|
|||||||
Table takeaways
The Top Fundraisers and Middle Fundraisers tables tell us about which types projects get the most funding. Projects related to personal electronics and transportation or travel received the most funding. In contrast, projects which received average (median) funding were arts, entertainment, or music related. Notably, a project for a personal electronic accessory was one of only two middle-funded projects that achieved its funding goal. The tables also show us that while the best funded projects are incredibly overfunded (raising 2 to 529 times their goal), projects in the middle often don’t even achieve their original funding goal.
What categories of products have the best chance of getting funded?
WB’s spreadsheet tells us what percent of its goal each project raised. That’ll tell us whether it was funded (raised 100% or more of its goal), or wasn’t (raised less than 100% of its goal). Through some further wrangling, we added a funded column (yes/no), to our data.
Show code
#funded or not wrangling
indiegogo_funded <- indiegogo %>%
  mutate(funded = if_else(funds_raised_percent >= 1, "yes", "no"))

if_prop <- indiegogo_funded %>%
  count(funded, category) %>%
  group_by(category) %>%
  mutate(prop = n/sum(n))
Show code
#plot 1

ggplot() +
   geom_text(data = if_prop, aes(x = funded,
                                 y = n,
                                 label = scales::percent(prop)),
                                 vjust = 0,
                                 size = 2.3) +
  geom_bar(data = indiegogo_funded, aes(x = funded, fill = funded)) +
  scale_fill_manual(values = c("red3", "forestgreen")) +
  facet_wrap(~category) +
  xlab("Funded?") +
  ylab("Count") +
  ggtitle("Which Categories Got Funded?") +
  ylim(0,150) +
  theme_minimal() +
  theme(strip.text.x = element_text(size = 5))
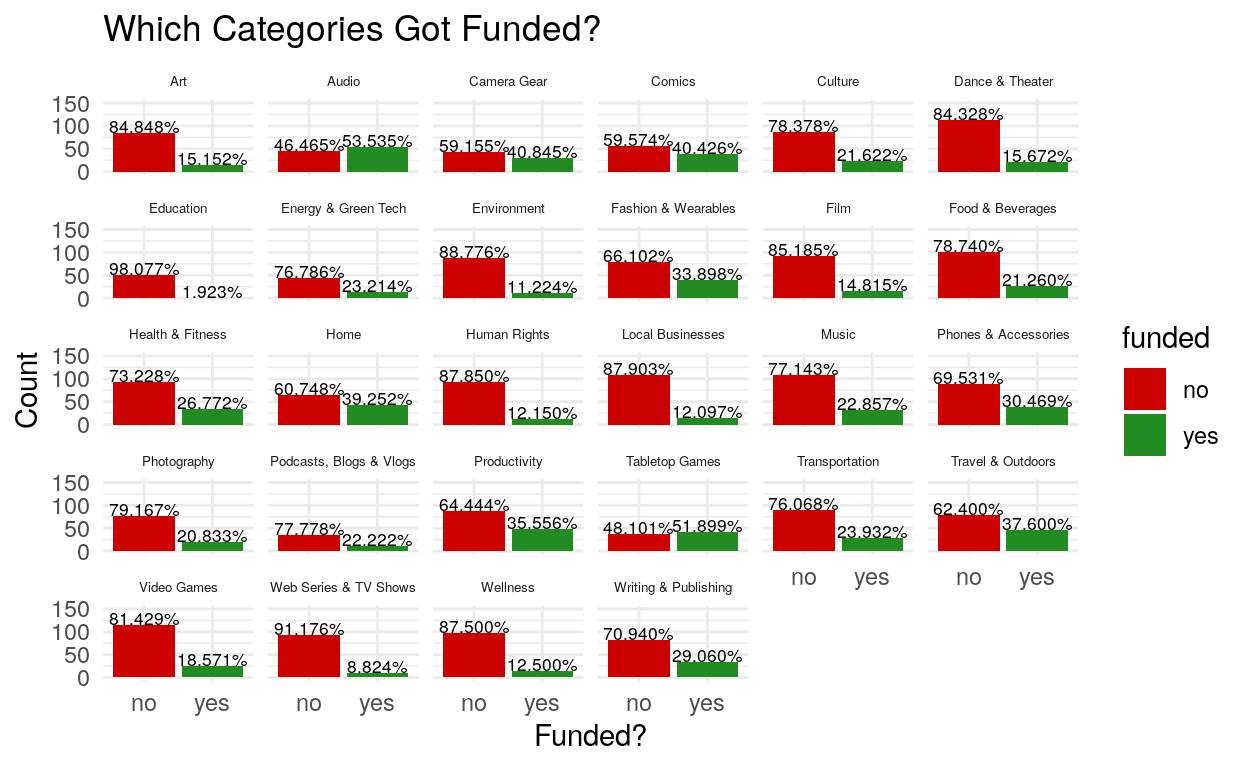
This graph shows which categories got funded. Alas, campaigns in most categories are more likely to fail. The only categories whose campaigns are more likely to succeed are audio (53% success) and tabletop games (51% success). The categories most likely to fail are education (98% failure) and web series & TV shows (91% failure).
What are the most common categories?
Show code
#plot 2 (common category)
indiegogo %>%
  count(category) %>%
  ggplot(aes(x = reorder(category, `n`), y = `n`)) +
  geom_bar(stat = 'identity', width = .70, fill = 'orange3', col = 'black') +
  theme(axis.text.x = element_text(angle = 90)) +
  xlab("Category") +
  ylab("Count") +
  ggtitle("Most Common Categories") +
  coord_flip() +
  theme_minimal()
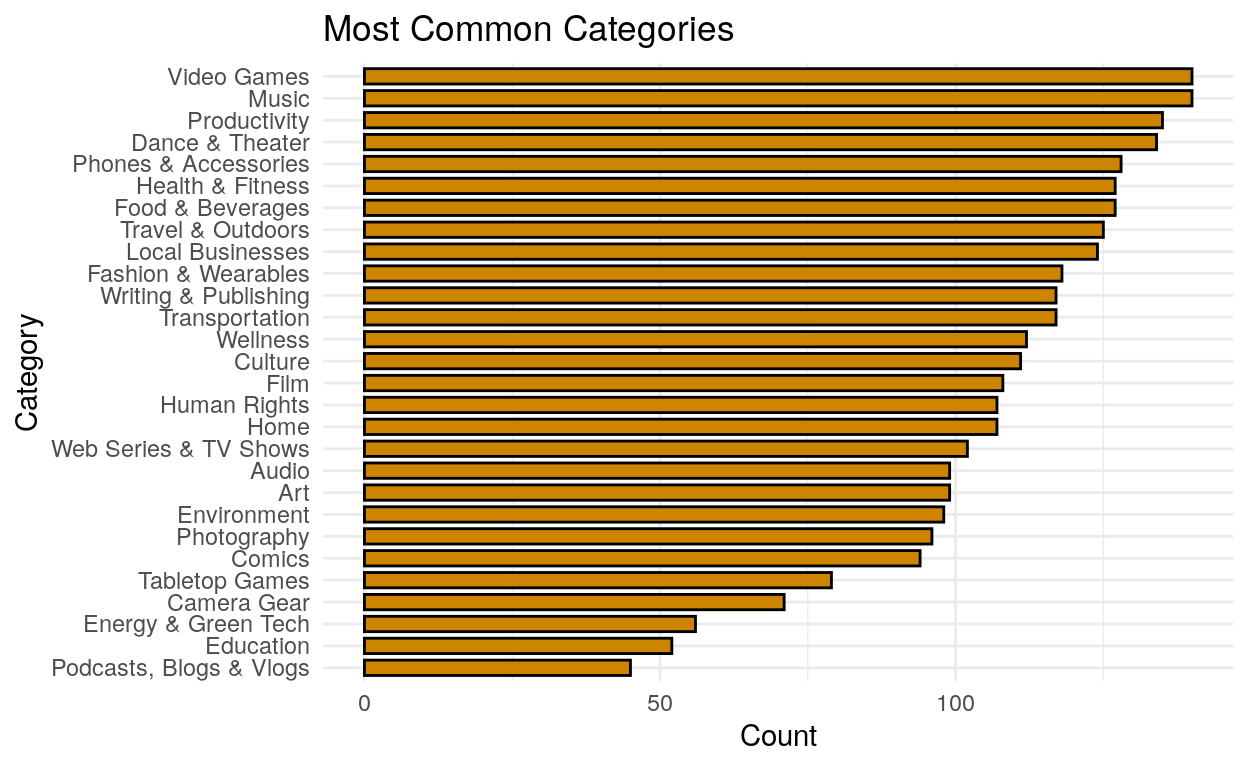
While the first graph above provides an overview of each category’s chance of getting funded, this graph tells us what kinds of products or projects people usually make on Indiegogo. It’s worth noting that audio and tabletop games, the only two categories more likely to succeed than fail, are also in the bottom half of common categories. Fewer people are making these products, but they are succeeding more often. Video games, meanwhile, are the second most common category, but they fail to meet their funding goals 81% of the time. However, it’s not always true that more common categories fail more often. Education is the second least common category, and also the most likely to fail (98% failure). That’s a serious bummer.
Project tags: Can they be your secret ingridient to success?
Fundraisers on Indiegogo can use tags to categorize their projects. So, which tags are best? In WB’s raw data, all tags were bundled together into a single column, so we separated them into their own columns. Another problem is that the ‘other’ tag was the most common by far, so we removed that from analysis.
Show code
#plot 3 (common tags)
indiegogo %>%
  separate(tags, c("tag0", "tag1", "tag2", "tag3", "tag4", "tag5")) %>%
  select(-tag0) %>%
  filter(tag1 != "other")  %>%
  count(tag1) %>%
  slice_max(order_by = `n`, n = 35) %>%
  ggplot(aes(x = reorder(tag1, `n`), y = `n`)) +
    geom_bar(stat = 'identity', width = .70, fill="#56B4E9", col = 'black') +
    theme(axis.text.x = element_text(angle = 90)) +
    xlab("Tag") +
    ylab("Count") +
    ggtitle("Top 35 Most Common First Tags (No 'Other')") +
    coord_flip() +
    theme_minimal()
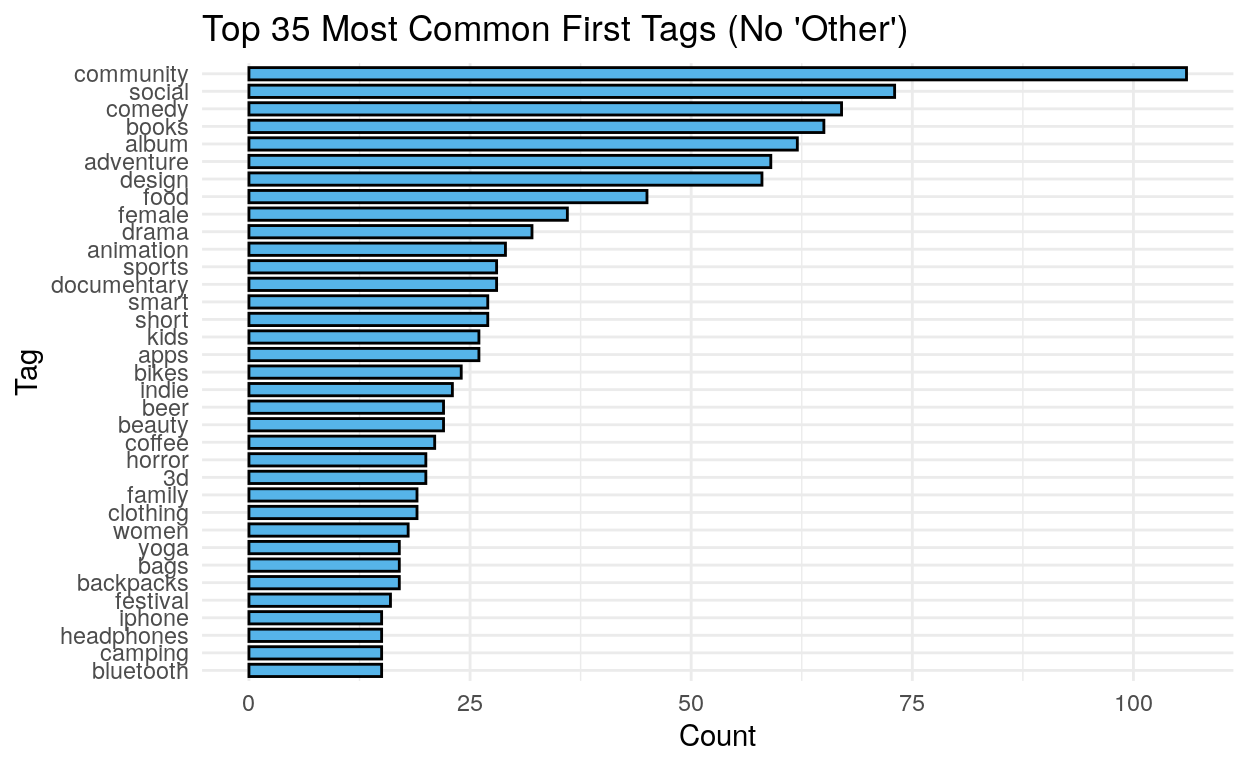
The most common first tag (aside from ‘other’) was community, followed by social, comedy, books, and album. Interestingly, community was noticeably more frequent than the other common tags. There might be some overlap between successful categories and common tags: for example, audio seems related to album, and tabletop games could be related to social or community, but this could also be a coincidence. After all, the most common tag by far was ‘other’.
Caveats!
The analysis in this article is based on an enormous dataset available from Web Robots. In order to effectively process this huge amount of information and avoid issues related to having too many points on graphs, we randomly extracted a smaller number of projects to analyze in this post (see initial data wrangling explanation for details). This analysis is thus not based on the complete dataset that is available, but rather on a subset. Keep that in mind!
To allow for comparisons between different indiegogo projects, we considered only projects that used US dollars in the tables. The data we drew on to create the tables is thus only a part of the entire dataset and may not always represent the larger dataset (the graphs include all currencies, though).
Last words:
Using these data on indiegogo projects, we’ve examined what types of projects are commonly proposed and what types of projects actually attain sufficient funding. We found that the best funded projects tend to be related to personal technology and tabletop games, which are also some of the less commonly proposed projects. However, this correlation between infrequency and high funding does not always hold true. Overall there seems to be a disconnect between what is popular and what is well funded but this does not explain all of the patterns within these data. The qualities that make a good indiegogo project are much more complicated than these simple ideas, but we have demonstrated one interesting way to go about examining trends within these types of projects.
So go forth and chase your entrepreneurial dreams! Or, if you’re the pragmatic sort, reimagine and repackage those dreams as a hit board game.