Show code
knitr::include_graphics("plastics.PNG")
Introduction
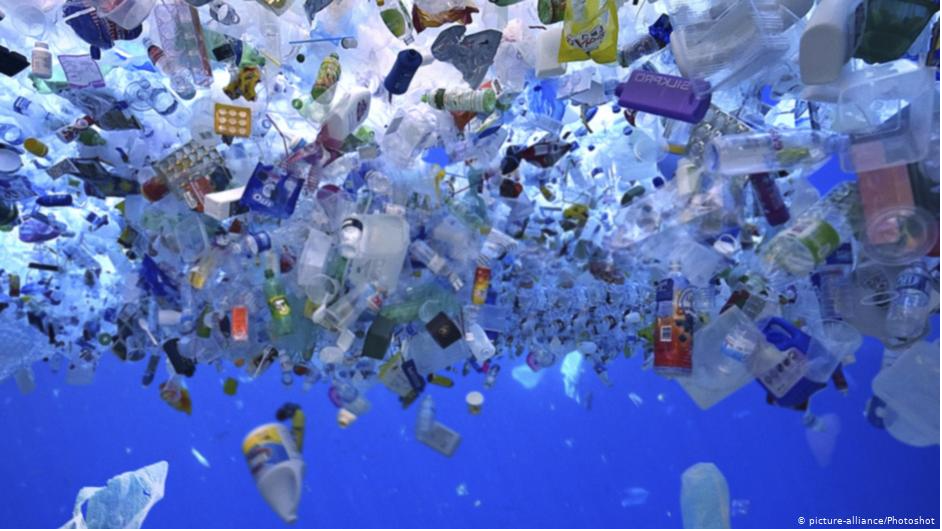
Containing 97% of the world’s water, Earth’s oceans are a vast landscape of exploration and life support (“100+ Plastic in the Ocean Statistics & Facts (2020-2021)” n.d.). With an estimated 91% of all ocean species yet to be classified by modern science, our oceans house a breadth of species, life, possibility, and opportunity. In contrast to this perception, the ocean is facing a different reality (US Department of Commerce n.d.). As of 2020, it is estimated that earth’s ocean now contains more plastics than individual fish (US Department of Commerce n.d.).
Plastic pollution has been increasing worldwide and presents a danger to aquatic life around the globe. Some types of plastic deteriorate faster than other plastics which can turn into microplastics. Microplastics are tiny pieces (ranging from 5 to 10 μm) of plastic that can be found everywhere on Earth! Scientists estimated that there are somewhere around 15- 51 trillion pieces of microplastic in the ocean (Sebille et al. 2015). A recently published article that examined the amount of microplastic in freshwater fish specimens found that the concentration of microplastics have been increasing over the past 50 years (Hou et al. n.d.). Furthermore, some scientists estimate the average person consumes a credit card’s worth of plastic each week! To prevent microplastics from further interfering with natural aquatic habitats and to help human health, collecting plastic waste is critically important.
A good way to examine plastic pollution is to measure how many volunteers collect plastic waste. Furthermore, these volunteers can give information about the type of plastic and the company that the plastic came from. An organization known as Break From Plastic has provided datasets from 2019 and 2020. We will explore their dataset to see how COVID-19 has affected plastic collection efforts and overall composition of plastic. Furthermore, we will examine the overall plastic composition and determine what companies.
Visualizations and Tables
Show code
# Wrangle
plastics <- readr::read_csv('https://raw.githubusercontent.com/rfordatascience/tidytuesday/master/data/2021/2021-01-26/plastics.csv')
plastics1 <- plastics %>%
  drop_na()

gtplastics <- plastics1 %>%
  group_by(country, year, num_events) %>%
  summarise(mean_vol = mean(volunteers),
            mean_grand = mean(grand_total)) %>%
  filter(country %in% c("Argentina", "India", "Indonesia", "Philippines", "Vietnam")) %>%
  as.data.frame()

# gt table
gtplastics %>%
  gt() %>%
  tab_header(
    title = "Plastic event around the world from 2019 to 2020") %>%
  tab_spanner(label = "Average",
              columns = vars("num_events",
                             "mean_vol",
                             "mean_grand")) %>%
  cols_label(
    country = "Country",
    year = "Year",
    num_events = "Events",
    mean_vol = "Volunteer",
    mean_grand = "Grand Total of Plastic") %>%
  data_color(
    columns = vars("mean_grand"),
    colors = scales::col_numeric(
      as.character(paletteer::paletteer_d("ggsci::teal_material",
                                          n = 10)),
      domain = c(4, 460)
    )) %>%
  data_color(
    columns = vars("mean_vol"),
    colors = scales::col_numeric(
      as.character(paletteer::paletteer_d("ggsci::purple_material",
                                          n = 10)),
      domain = c(8, 7000)
    )) %>%
  data_color(
    columns = vars("num_events"),
    colors = scales::col_numeric(
      as.character(paletteer::paletteer_d("ggsci::orange_material",
                                          n = 10)),
      domain = c(4, 60)
    )) %>%
  data_color(
    columns = vars("year"),
    colors = scales::col_numeric(
      as.character(paletteer::paletteer_d("ggsci::blue_material",
                                          n = 5)),
      domain = c(2018, 2020)
    )) %>%
  tab_source_note(
      source_note = "Source: Break Free from Plastic courtesy of Sarah Sauve") %>%
  tab_source_note(
      source_note = "Reference: https://github.com/rfordatascience/tidytuesday/blob/master/data/2021/2021-01-26/readme.md")
| Plastic event around the world from 2019 to 2020 | ||||
|---|---|---|---|---|
| Country | Year | Average | ||
| Events | Volunteer | Grand Total of Plastic | ||
| Argentina | 2019 | 4 | 243 | 19.40364 |
| Argentina | 2020 | 24 | 9 | 4.80531 |
| India | 2019 | 4 | 88 | 19.77033 |
| India | 2020 | 56 | 353 | 48.77299 |
| Indonesia | 2019 | 32 | 6850 | 41.85220 |
| Indonesia | 2020 | 50 | 392 | 34.54422 |
| Philippines | 2019 | 20 | 3751 | 104.12377 |
| Philippines | 2020 | 17 | 915 | 459.86667 |
| Vietnam | 2019 | 4 | 400 | 32.11504 |
| Vietnam | 2020 | 6 | 27 | 68.82031 |
| Source: Break Free from Plastic courtesy of Sarah Sauve | ||||
| Reference: https://github.com/rfordatascience/tidytuesday/blob/master/data/2021/2021-01-26/readme.md | ||||
We are interested in the influence of the pandemic to plastics events around the world from 2019 and 2020. We picked 5 countries that are most engaged in the events and compared their numbers of events, numbers of volunteers, and grand total of plastics. The colors of the “year” column distinguish 2019 and 2020. The gradient colors of other columns indicate the scales of each variable, with darker colors representing larger values. The colors enable us to compare events, volunteers and grand total within countries as well as across countries and years. According to the graph, the numbers of volunteers decreased a lot in Argentina, Indonesia, Philippines and Vietnam. However, there is an increase in volunteers in India. By contrast, the numbers of plastics events largely increased in Argentina, India and Indonesia and slightly decreased in Philippines and Vietnam. Thus, we can infer that even though less volunteers were engaged in plastics events from 2019 to 2020, these countries tried to organize more or maintain enough plastics events and more actively engaged in the events to protect the environment and raise awareness of plastic pollution. Another main variable is the grand total of plastics. Despite the tremendous decrease in the numbers of volunteers in the Philippines, the grand total of plastic wastes collected in 2020 reached the highest amount since 2019 across all countries. This increase in the grand total of plastics from 2019 to 2020 also happened to India and Vietnam. Although the grand total of plastic waste decreased in Argentina and Indonesia, the decrease was small compared to the increase in 2020 overall.
Show code
# animated pie chart
gifplastic <- plastics1 %>%
  filter(parent_company != "null", parent_company != "Unbranded", parent_company != "Grand Total",
         country %in% c("United States of America", "Philippines", "Indonesia", "Vietnam", "India")) %>%
  group_by(country) %>%
  summarise(hdpe = sum(hdpe),
            ldpe = sum(ldpe),
            o = sum(o),
            pet = sum(pet),
            pp = sum(pp),
            ps = sum(ps),
            pvc = sum(pvc))
df <- pivot_longer(gifplastic, cols = c("hdpe", "ldpe", "o", "pet", "pp", "ps", "pvc"), names_to = "type", values_to = "count")


df2 <- df %>%
  mutate(cp1 = c(0, head(cumsum(count), -1)),
         cp2 = cumsum(count))
saveGIF({
  for (i in unique(df2$country)) {
    p = ggplot(df2 %>% filter(country==i), aes(fill=type)) +
      geom_rect(aes(xmin=0, xmax=max(cp2), ymin=cp1, ymax=cp2)) +
      facet_grid(~country) +
      coord_polar("y", start=0) +
      scale_x_continuous(limits=c(0,max(df2$cp2))) +
      scale_fill_brewer(type = "qual", palette = 3) +
      ggtitle("Plastics composition by country") +
      theme(text = element_text(size=20),
            plot.title = element_text(face = "bold", hjust = 0),
            axis.title.x = element_blank(),
            axis.title.y = element_blank(),
            legend.title = element_text(face = "bold"))
    print(p)
  }
}, interval = 4, movie.name="test2.gif", ani.width = 600, ani.height = 600)
[1] TRUEShow code
knitr::include_graphics("test2.gif")
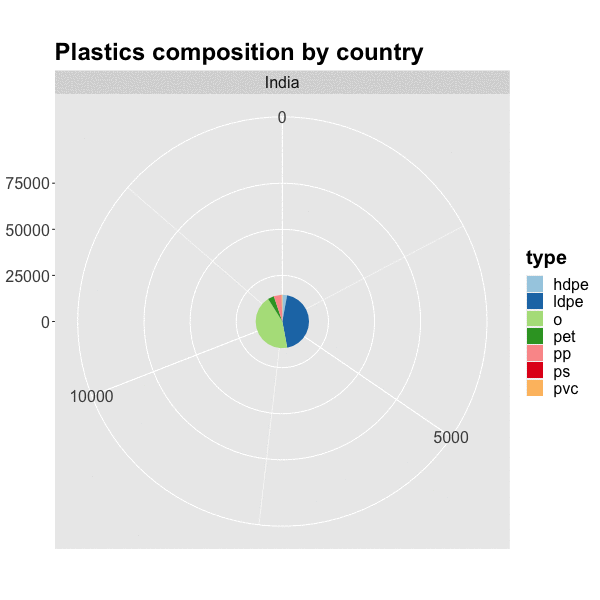
To further investigate the sources of plastic wastes, we examine the 7 types of plastics (hdpe, ldpe, o, pet, pp, ps, and pvc) in several countries. Each pie chart represents the composition of plastics of each country. The sizes of pie charts indicate the grand total of plastics. According to the graphs, o and/or pet were the two most common plastics in the USA, Vietnam, India, and Indonesia. In India, the proportion of ldpe is about the same as o. However, in the Philippines, pp was the most common plastic and the proportion of pet was much smaller compared to other countries. Ps and pvc were the smallest components among all plastics across countries. Pet, ldpe and hdpe are regarded as safe plastics that are relatively easy to be recycled (“Types of Plastic - A Complete Plastic Numbers Guide” n.d.). It is good news that pet and ldpe were huge components of all plastics in these countries. By contrast, pvc and pp are dangerous plastics and have low recycle rates. Pp plastics composed more than half of the total plastics in the Philippines, which indicates that more efforts should be made to advocate recyclable plastics. The grand totals of plastics in India and Indonesia were relatively small compared to other countries. Since the data only reveals the plastics collected by volunteers, it is possible that the small amount was resulted from inadequate events or volunteers.
Show code
knitr::include_graphics("bev.PNG")
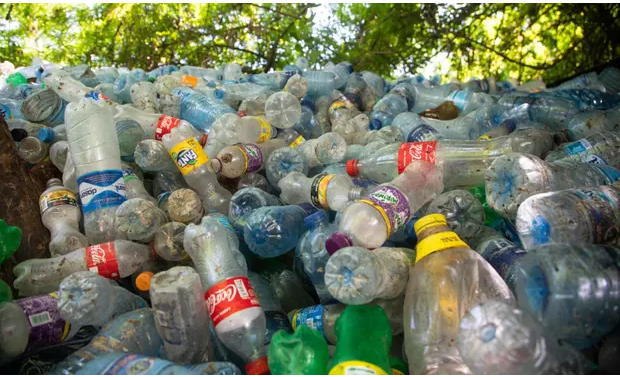
Photograph: Daniel Msirikale/Tearfund
Show code
comp <- plastics %>%
  drop_na() %>%
  filter(str_detect(parent_company, "Pepsi|Coca|Nestle|Anheuser-Busch")) %>%
  as.data.frame()

bev_comp <- comp %>%
  filter(year == 2020) %>%
  mutate(Company = case_when(parent_company %in% c("The Coca-Cola Company", "Innocent / The Coca-Cola Company", "PT Coca Cola Indonesia") ~ "Coca-Cola",
                            parent_company %in% c("PepsiCo", "Pepsico") ~ "Pepsi",
                            parent_company == "Nestle" ~ "Nestle",
                            parent_company %in% c("Anheuser-Busch", "Anheuser-Busch Inbev", "Anheuser-Busch InBev") ~ "Anheuser-Busch")) %>%
  drop_na(Company) %>%
  mutate(Company = fct_relevel(Company, "Coca-Cola", "Nestle", "Pepsi", "Anheuser-Busch")) %>%
  group_by(Company) %>%
  summarise(hdpe = sum(hdpe),
            ldpe = sum(ldpe),
            o = sum(o),
            pet = sum(pet),
            pp = sum(pp),
            ps = sum(ps),
            pvc = sum(pvc)) %>%
  pivot_longer(cols = c("hdpe", "ldpe", "o", "pet", "pp", "ps", "pvc"), names_to = "type", values_to = "count")


ggplot(data = bev_comp, mapping = aes(x = Company, y = count, fill = type)) +
  geom_col() +
  coord_flip() +
  scale_fill_brewer(type = "qual", palette = 6) +
  ggtitle("Plastic Composition Of Selected Companies") +
  theme(legend.position = "bottom",
        plot.title = element_text(hjust = 0))
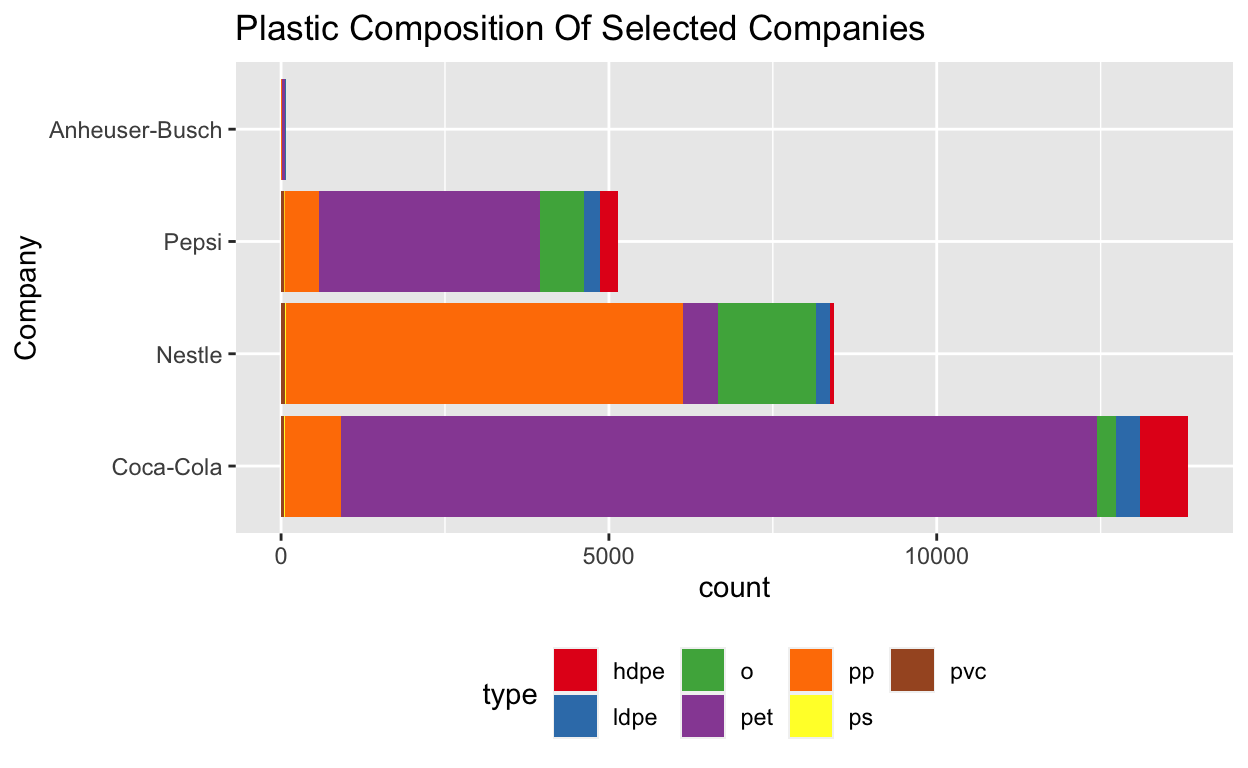
Since the data only reveals the plastics collected by volunteers, it is possible that the small amount was resulted from inadequate events or volunteers. The nature of this bottleneck of data acquisition is evident in cases such as Brand-Name analysis of waste. When looking at the amount of plastics in the figure above, it should not be interpreted that these values reflect the amount of plastic waste produced by these brands. Instead, these numbers solely represent the amount of plastic that has 1) survived ocean conditions enough to wash up in a recognizable condition, 2) has a brand name or logo intact, and 3) has been accounted for in a clean-up that publishes reports. These circumstances favor plastics such as a Coca-Cola brand plastic bottle. The recognizable colors, labels, and even shape of the bottle make the item an easily identifiable waste product despite ocean conditions. Companies that create high amounts of waste commercially with less rigid packaging and logos, such as Amazon, appeared in such low numbers on our visualization we even had to consider them outliers and subject for removal. The context of this data is valuable because it can help us uniquely identify detrimental ocean pollutants.
Conclusions
As young eco-conscious students researching this topic, we each had our own personal experiences with ocean waste and participating in beach clean ups. On the ground, the amount of plastic pollution is a grimm sight. The promise it holds is that clean-up data ultimately helps inform models such as these. In turn, models can inform beach clean-up efforts. This exploration of the dataset demonstrates how plastics are a global problem. Other datasets could be integrated into future explorations of global plastic pollution. While it may seem overwhelming, there are many creative solutions to reducing plastic pollution. Reducing plastic production would be the best way to ensure that plastic does not further disrupt marine ecosystems and human health. Many environmentally friendly materials are being developed and it is important to minimize our consumption of plastics. Thank you to the efforts of volunteers who collected plastic, and the fellow data scientists who made it possible for us to analyze.
Show code
knitr::include_graphics("week1AustraliacAnnaChah-105.jpg")
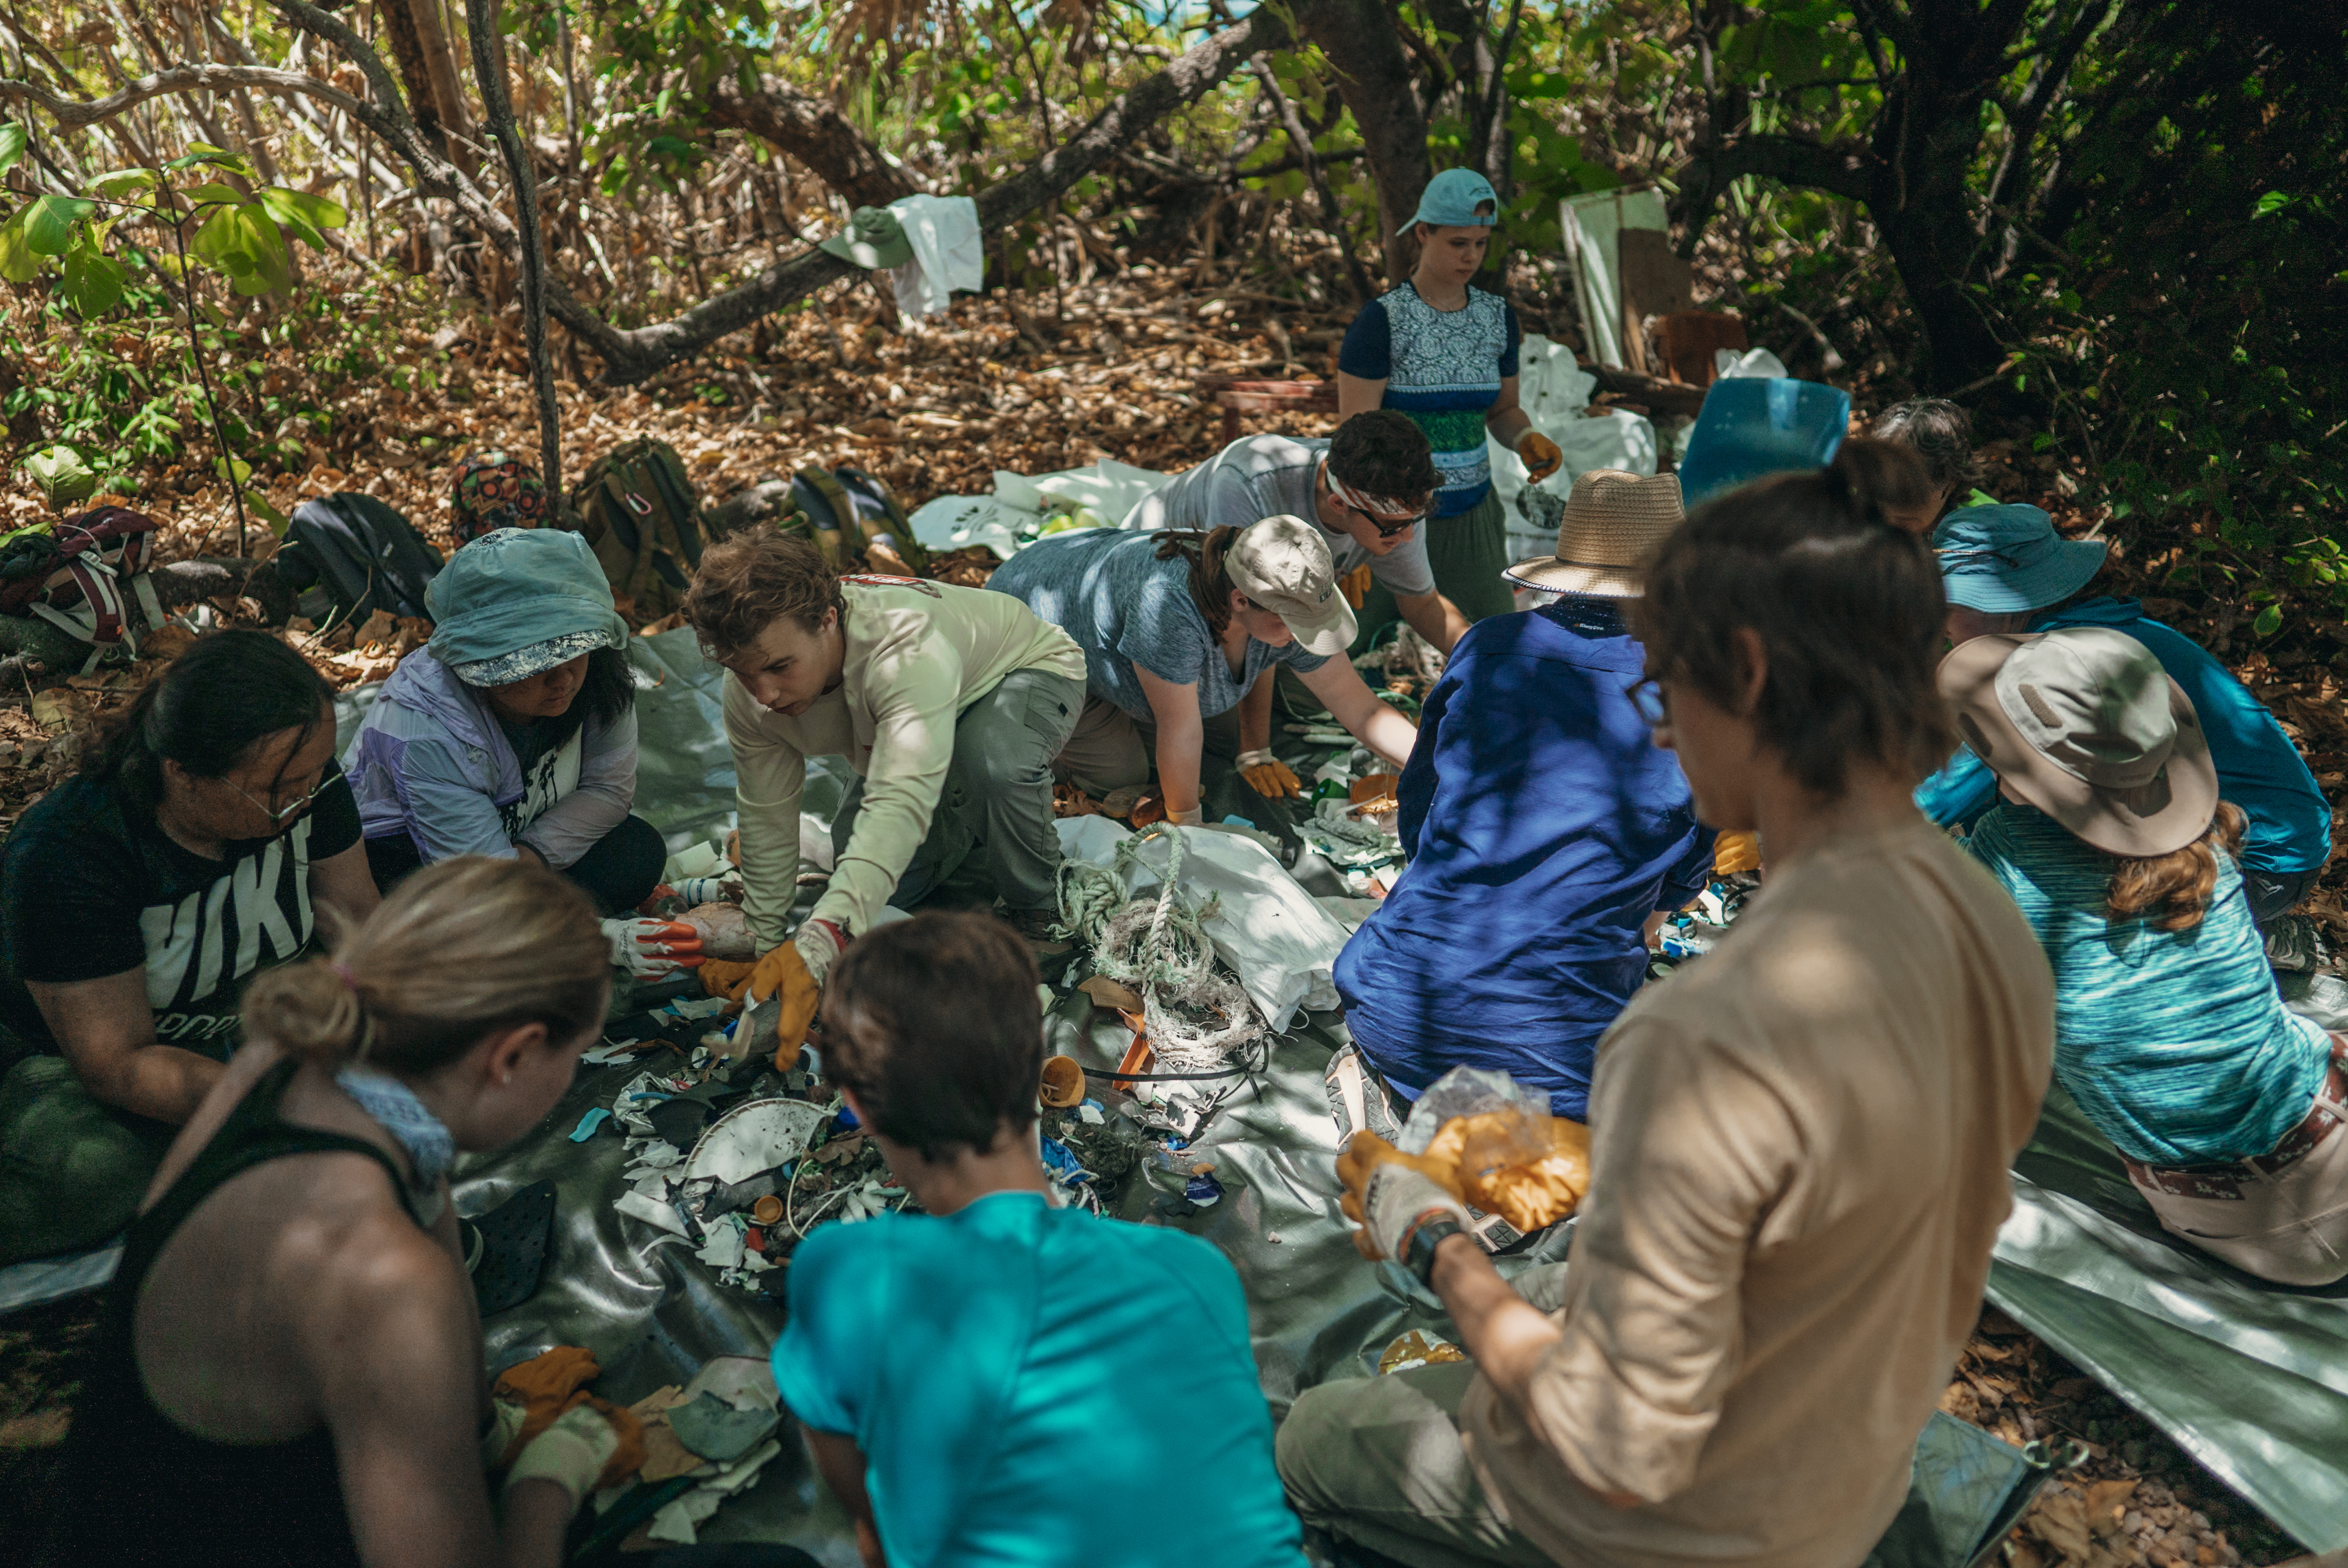
Photograph: Anna Chah
Hou, Loren, Caleb D. McMahan, Rae E. McNeish, Keenan Munno, Chelsea M. Rochman, and Timothy J. Hoellein. n.d. “A Fish Tale: A Century of Museum Specimens Reveal Increasing Microplastic Concentrations in Freshwater Fish.” Ecological Applications n/a (n/a): e02320. Accessed May 10, 2021. https://doi.org/https://doi.org/10.1002/eap.2320.
Sebille, Erik van, Chris Wilcox, Laurent Lebreton, Nikolai Maximenko, Britta Denise Hardesty, Jan A. van Franeker, Marcus Eriksen, David Siegel, Francois Galgani, and Kara Lavender Law. 2015. “A Global Inventory of Small Floating Plastic Debris.” Environmental Research Letters 10 (12): 124006. https://doi.org/10.1088/1748-9326/10/12/124006.
US Department of Commerce, National Oceanic and Atmospheric Administration. n.d. “What Is an Sponge?” Accessed May 10, 2021. https://oceanservice.noaa.gov/facts/ocean-species.html.